Using custom dashboards to monitor CD deployments
An Explore is a starting point for a query that is designed to explore a particular subject area. This topic describes the various explores available for monitoring CD deployments, and the data the provide. The following image shows the list of explores available for visualizing CD data.
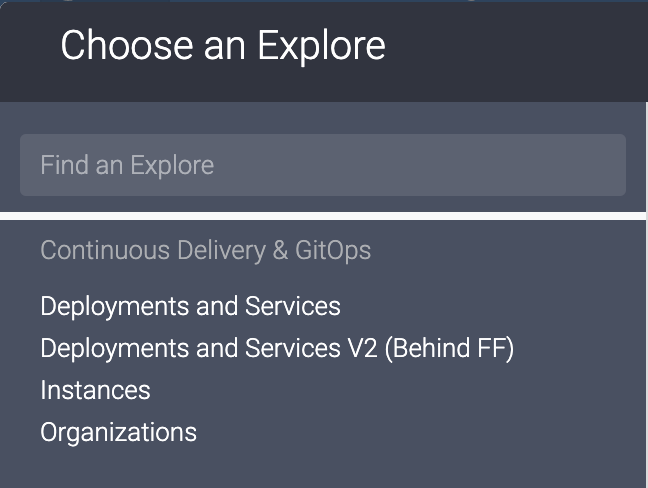
It is recommended to refer this documentation first to get a basic overview on how to create dashboards.
Deployments and Services
This explore can be used to visualize CD data related to pipeline executions. Each explore has a set of views. The views present in this explore are:
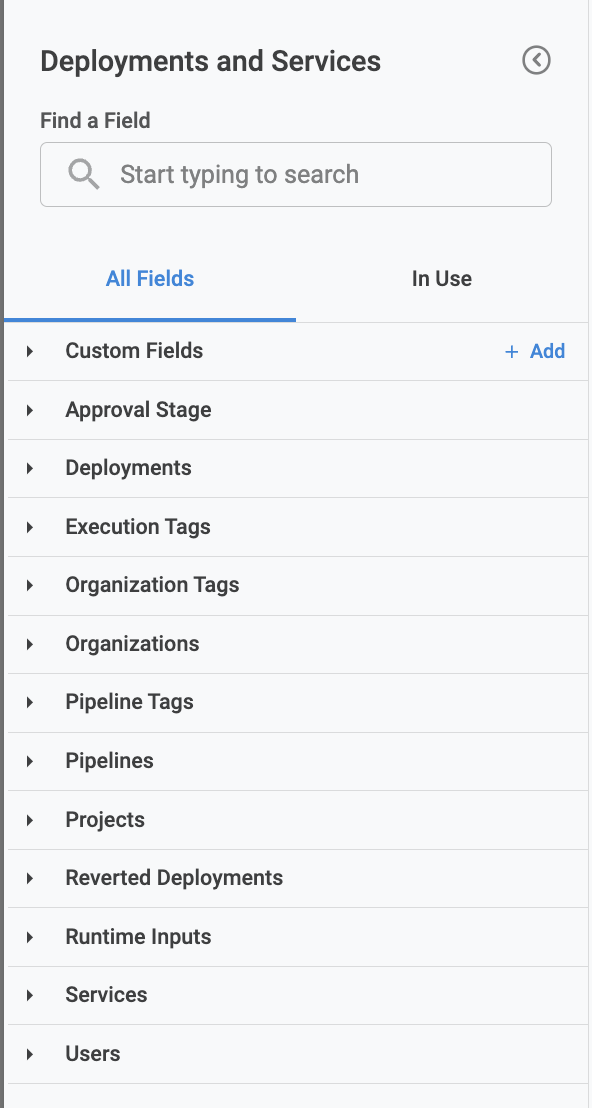
Let's go through each of the views listed above and describe its fields and usages.
Approval Stage
This view contains the data related to the Helm manifest info that is used in CD stage executions. The data is recorded per CD stage execution. For example, if there are 10 executions of a single service with a Helm manifest linked to it, this view will have 10 records.
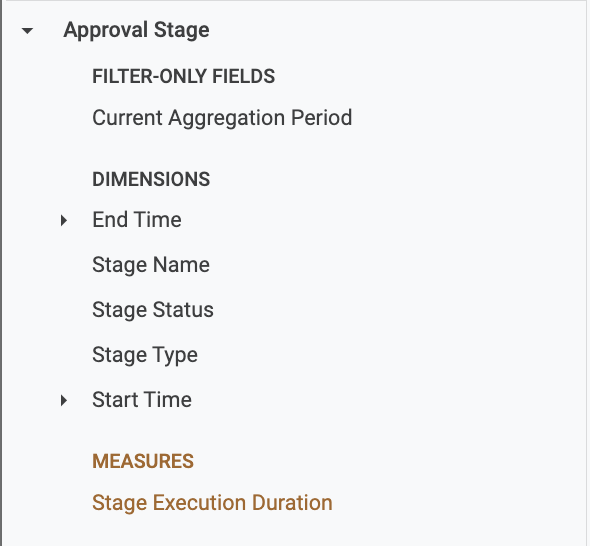
Filter-only Field:
- Current Aggregation Period:
List of dimensions:
- End Time: End time of the stage execution
- Stage Name: Name of the stage
- Stage Status: Current status of the stage(
RUNNING/FAILEDetc.) - Stage Type: Type of the stage(
Approvals) - Start Time: Start time of the stage execution
List of measures:
- Stage Execution Duration: Average stage execution duration
Deployments
This view contains the data related to pipeline executions. The data is recorded per pipeline execution, meaning if there are 10 pipeline executions, then this view will also have 10 records.
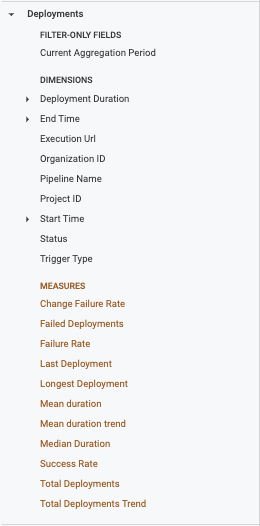
Filter-only Field:
- Current Aggregation Period:
List of dimensions:
- Deployment Duration: Duration of the pipeline execution
- End Time: End time of the pipeline execution
- Execution Url: URL of pipeline execution
- Organization ID: Organization identifier where the pipeline got executed
- Pipeline Name: Name of the pipeline
- Project ID: Project identifier where the pipeline got executed
- Start Time: Start time of the pipeline execution
- Status: Pipeline status(
RUNNING/ABORTED/SUCCESSetc.) - Trigger Type: Type of trigger used to execute the pipeline(
MANUAL/WEBHOOKetc.)
List of measures:
- Change Failure Rate: Total deployments that have been reverted divided by the total no. of deployments
- Failed Deployments: No. of deployments that failed with
FAILED/ABORTEDstatuses - Failure Rate: Failure rate of deployments(Failed Deployments divided by total no. of deployments)
- Last Deployment: Last deployment time
- Longest Deployment: Longest deployment time
- Mean duration: Average pipeline duration
- Mean duration trend: This compares the mean duration trend from the previous period to the current period
- Median Duration: Median duration of the deployment
- Success Rate: Success rate of deployments(deployments completed with
SUCCESSstatus) - Total Deployments: Total no. of deployments
- Total Deployments Trend: This compares the deployment count from the previous period to the current period
Execution Tags
This view contains the data related to pipeline execution tags. It will contain the tags that were present in the pipeline at the start of the execution.
List of dimensions:
- Execution tag: The execution tag, it will be displayed as
key:value. If there are let's say 5 tags in a pipeline, there will be 5 rows having 1 tag(key:valuepair) in each row
Organization Tags
This view contains the data related to the organization tags. It will contain the real-time tags of the organization.
List of dimensions:
- Organization tag: The organization tag. It will be displayed as
key:value. For example, if there are 5 tags in an organization, there will be 5 rows having 1 tag (key:valuepair) in each row.
Organizations
This view contains the data related to organizations.
This will only show the organizations that had at least 1 pipeline execution (in any project). It won't display the organizations that didn't contain any pipeline executions.
List of dimensions:
- Organization tag: The organization tag, displayed as
key:value. For example, if there 5 tags in an organization, there will be 5 rows having 1 tag (key:valuepair) in each row.
Pipeline Tags
This view contains the data related to pipeline tags. It will contain the real-time tags of the pipeline.
This will only show the pipelines that had at least 1 pipeline execution. It won't display the tags for the pipelines that didn't get executed even once.
List of dimensions:
- Pipeline tag: The pipeline tag, displayed as
key:value. For example, if there are 5 tags in a pipeline, there will be 5 rows having 1 tag (key:valuepair) in each row.
Service Tags
Displays a list of tags associated with a service.
Service Tags only displays the tags for the services that were part of pipelines that were successfully executed at least once.

List of dimensions:
- Service tag: The service tag is displayed as
key:value. For example, if there are 5 tags in a service, there will be 5 rows having 1 tag (key:valuepair) in each row.
Environment Tags
Displays a list of tags associated with a environment.
Environment Tags only displays the tags for the environments that were part of pipelines that were successfully executed at least once.

List of dimensions:
- Environment tag: The environment tag is displayed as
key:value. For example, if there are 5 tags in a environment, there will be 5 rows having 1 tag (key:valuepair) in each row.
Pipelines
This view contains the data related to the pipelines.
This will only show pipelines that had at least 1 execution. It won't display the pipelines that didn't had any executions.
List of dimensions:
- Created Time: Creation time of the pipeline
- Modified Name: Modification time of the pipeline
- Pipeline Name: Name of the pipeline
Projects
This view contains the data related to the projects.
This will only show projects with at least 1 pipeline execution. It won't display the projects that didn't have any pipeline executions.
List of dimensions:
- Created Time: Creation time of the project
- Modified Name: Modification time of the project
- Project Name: Name of the project
Reverted Deployments
This view contains the data related to reverted pipeline executions.
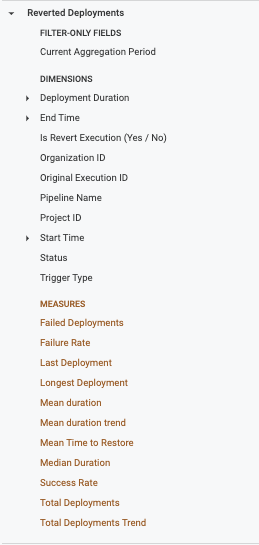
Filter-only Field:
- Current Aggregation Period:
List of dimensions:
- Deployment Duration: Duration of the pipeline execution
- End Time: End time of the pipeline execution
- Is Revert Execution (Yes / No): Specifies if the execution got reverted
- Organization ID: Organization identifier where the pipeline got executed
- Original Execution ID: Original execution id of the pipeline which got reverted
- Pipeline Name: Name of the pipeline
- Project ID: Project identifier where the pipeline got executed
- Start Time: Start time of the pipeline execution
- Status: Pipeline status (
RUNNING/ABORTED/SUCCESSetc.) - Trigger Type: Type of trigger used to execute the pipeline (
MANUAL/WEBHOOKetc.)
List of measures:
- Failed Deployments: No. of deployments that failed with
FAILED/ABORTEDstatuses - Failure Rate: Failure rate of deployments(Failed Deployments divided by total no. of deployments)
- Last Deployment: Last deployment time
- Longest Deployment: Longest deployment time
- Mean duration: Average pipeline duration
- Mean duration trend: This compares the mean duration trend from the previous period to the current period
- Mean Time to Restore: Measures the mean time to restore
- Median Duration: Median duration of the deployment
- Success Rate: Success rate of deployments (deployments completed with
SUCCESSstatus) - Total Deployments: Total no. of deployments
- Total Deployments Trend: This compares the deployment count from the previous period to the current period
Runtime Inputs
This view contains the data related to the runtime inputs provided at the time of the pipeline execution. This will contain only the user provided runtime inputs when a pipeline is executed.
- This doesn't show nested runtime inputs. For example, let's say a service has a variable as runtime input, and a pipeline has its service as a runtime also. Then Harness won't show the service variable in the list.
- This doesn't store execution inputs.
List of dimensions:
- FQN: FQN of the runtime input
- Input Key: Key of the runtime input
- Input Value: Value given to the runtime input
Services
This view contains the data related to the service and environment configurations.
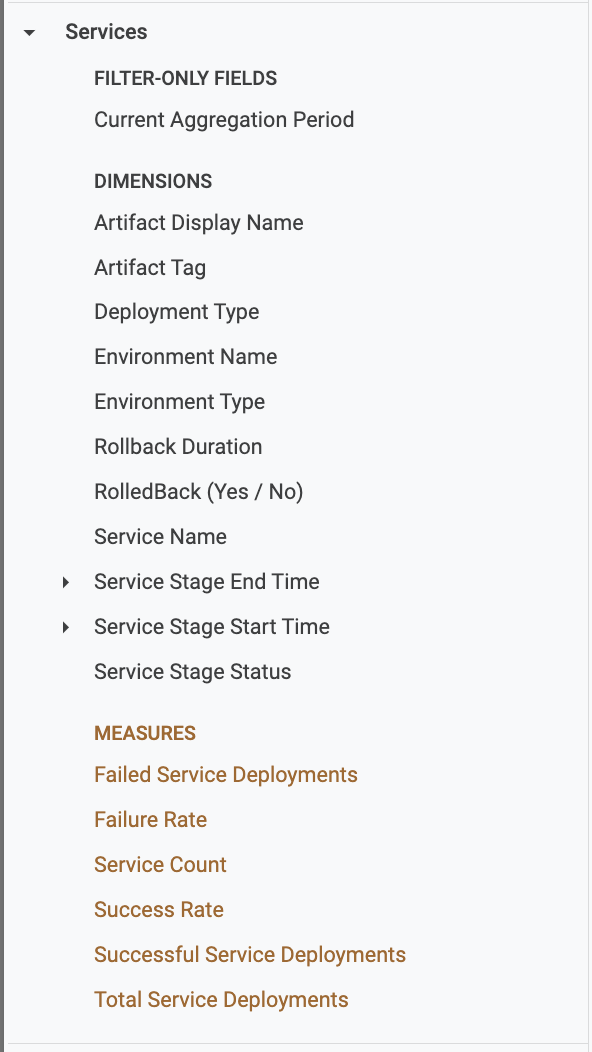
Filter-only Field:
- Current Aggregation Period:
List of dimensions:
- Artifact Display Name: Display name of the artifact being deployed in the execution
- Artifact Tag: Artifact tag being deployed
- Deployment Type: Deployment type of the service
- Environment Name: Name of the environment being used for the execution
- Environment Type: Type of the environment(
Production/PreProduction) - Rollback Duration: Rollback duration of the stage
- RolledBack (Yes / No): Signifies if the stage execution did roll back
- Service Name: Name of the service being deployed.
- Service Stage End Time: End time of the CD stage
- Service Stage Start Time: Start time of the CD stage
- Service Stage Status: Status of the CD stage
List of measures:
- Failed Service Deployments: No. of deployments that failed with
FAILED/ABORTEDstatuses - Failure Rate: Failure rate of deployments(Failed Deployments divided by total no. of deployments)
- Service Count: Distinct no. of services that got deployed
- Success Rate: Success rate of the deployment
- Successful Service Deployments: No. of executions that completed with
SUCCESSstatus. - Total Service Deployments: Total no. of deployments
Users
This view contains the data related to users.
This will only show the users that have triggered at least 1 pipeline execution. It won't display the users that didn't trigger any pipeline execution.
List of dimensions:
- Created At: Time at which user was created
- Email id: Email id of the user
- Updated At: Time at which user was updated
- User Name: User name
Deployments and Services V2 (Behind FF)
This explore can be used to visualize CD data related to pipeline, stage, and step executions. Each explore has a set of views. The views present in this explore are:
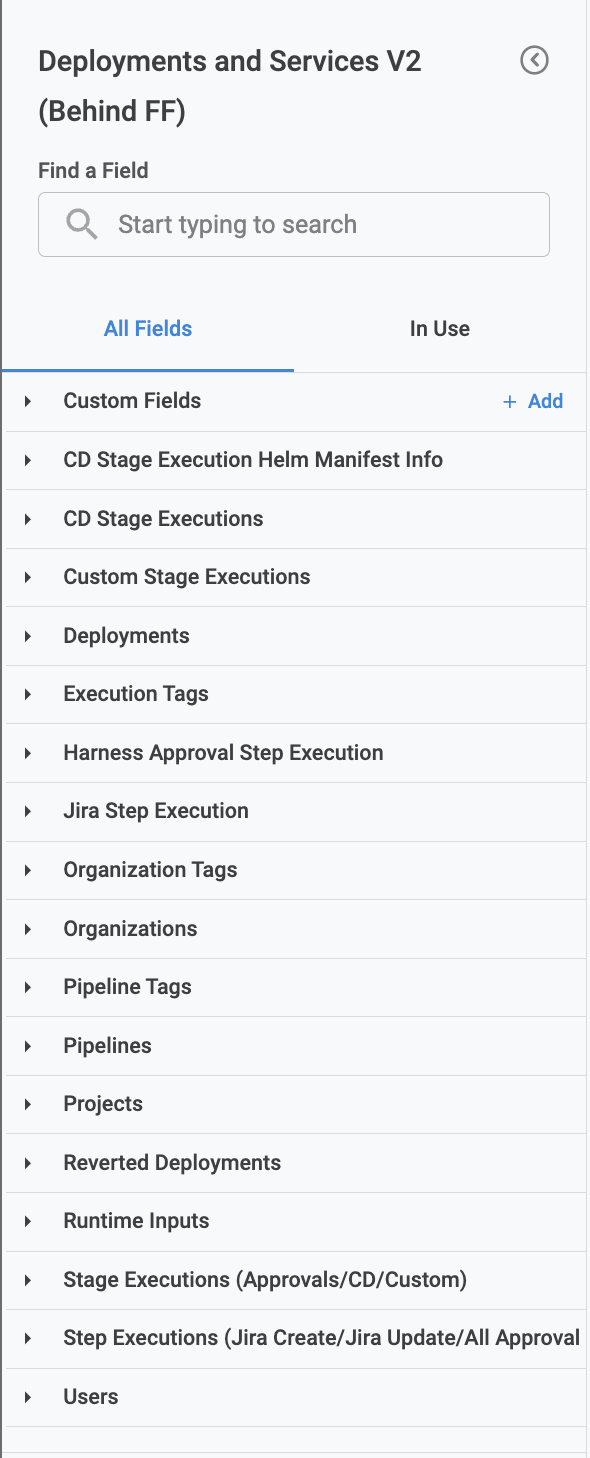
Let us go through each of the view listed in the above image, and describe the fields and it's usages.
CD Stage Execution Helm Manifest Info
This view contains the data related to the Helm manifest info that is used in CD Stage executions. The data is recorded per CD stage execution, meaning if there are 10 executions of a single service that has a Helm manifest linked to it this view will also have 10 records.
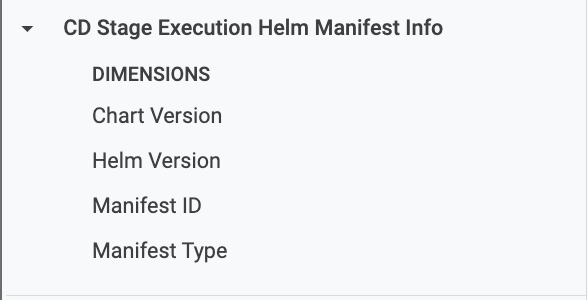
List of dimensions:
- Chart Version: Chart version of the manifest
- Helm Version: Helm version of the manifest
- Manifest ID: Manifest id configured in the service
- Manifest Type: Type of the manifest, currently it only stores for manifest of type
HelmChart
CD Stage Executions
This view contains data related to the CD stage executions. The data is recorded per CD stage execution, meaning if there are 10 pipeline executions that contain a single CD stage, then this view will also have 10 records.
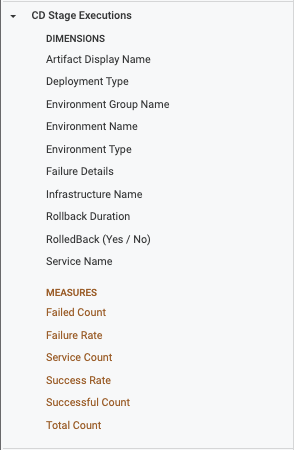
List of dimensions:
- Artifact Display Name: Display name of the artifact being deployed in the execution
- Deployment Type: Deployment type of the service
- Environment Group Name: Name of the environment group being used for the execution
- Environment Name: Name of the environment being used for the execution
- Environment Type: Type of the environment(
Production/PreProduction) - Failure Details: Failure message of the execution(if the CD Stage failed)
- Infrastructure Name: Name of the infrastructure being used for the execution
- Rollback Duration: Rollback duration of the stage
- RolledBack (Yes / No): Signifies if the stage execution did roll back
- Service Name: Name of the service being deployed.
List of measures:
- Failed Count: No. of stage executions that failed with
FAILED/ABORTED/EXPIREDstatuses. - Failure Rate: Rate of failure(Failed Count divided by the total no. of stage executions)
- Service Count: Count of distinct no. of services that got deployed.
- Success Rate: Rate of success(Successful Count divided by the total no. of stage executions)
- Successful Count: No. of stage executions that completed with
SUCCESS/SUCCEEDEDstatuses. - Total Count: Total no. of stage executions
Custom Stage Executions
This view contains the data related to the Custom Stage executions. The data is recorded per Custom Stage Execution, meaning if there are 10 pipeline executions, which contain a single Custom stage, then this view will also have 10 records.
List of dimensions:
- Environment Name: Name of the environment being used for the execution
- Environment Type: Type of the environment(
Production/PreProduction) - Failure Details: Failure message of the execution(if the Custom Stage failed)
- Infrastructure Name: Name of the infrastructure being used for the execution
Deployments
This view contains the data related to the pipeline executions. The data is recorded per pipeline execution, meaning if there are 10 pipeline executions, then this view will also have 10 records.

Filter-only Field:
- Current Aggregation Period:
List of dimensions:
- Deployment Duration: Duration of the pipeline execution
- End Time: End time of the pipeline execution
- Execution Url: URL of pipeline execution
- Organization ID: Organization identifier where the pipeline got executed
- Pipeline Name: Name of the pipeline
- Project ID: Project identifier where the pipeline got executed
- Start Time: Start time of the pipeline execution
- Status: Pipeline status(
RUNNING/ABORTED/SUCCESSetc.) - Trigger Type: Type of trigger used to execute the pipeline(
MANUAL/WEBHOOKetc.)
List of measures:
- Change Failure Rate: Total deployments that have been reverted divided by the total no. of deployments
- Failed Deployments: No. of deployments that failed with
FAILED/ABORTEDstatuses - Failure Rate: Failure rate of deployments(Failed Deployments divided by total no. of deployments)
- Last Deployment: Last deployment time
- Longest Deployment: Longest deployment time
- Mean duration: Average pipeline duration
- Mean duration trend: This compares the mean duration trend from the previous period to the current period
- Median Duration: Median duration of the deployment
- Success Rate: Success rate of deployments(deployments completed with
SUCCESSstatus) - Total Deployments: Total no. of deployments
- Total Deployments Trend: This compares the deployment count from the previous period to the current period
Execution Tags
This view contains the data related to the pipeline execution tags. It will contain the tags that were present in the pipeline at the start of the execution.
List of dimensions:
- Execution tag: The execution tag is displayed as
key:value. If there are let's say 5 tags in a pipeline, there will be 5 rows having 1 tag(key:valuepair) in each row.
Service Execution Tags
This view contains the data related to the service execution tags. It will contain the tags that were present in the service at the start of the execution.

List of dimensions:
- Service Execution tag: The execution tag is displayed as
key:value. If there are 5 tags in a service, there will be 5 rows having 1 tag(key:valuepair) in each row.
Environment Execution Tags
This view contains the data related to the environment execution tags. It will contain the tags that were present in the environment at the start of the execution.
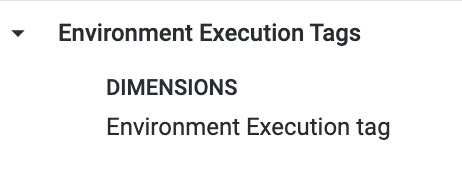
List of dimensions:
- Environment execution tag: The execution tag is displayed as
key:value. If there are 5 tags in a environment, there will be 5 rows having 1 tag (key:valuepair) in each row.
Harness Approval Step Execution
This view contains the data related to the Harness Approval Step Executions. If any field from this view is selected it will only show the data related to the executions which have a harness approval step. For e.g. if their are Jira approval and Harness Approval steps in a single pipeline execution, then selecting fields from this view, will only show Harness approval data.
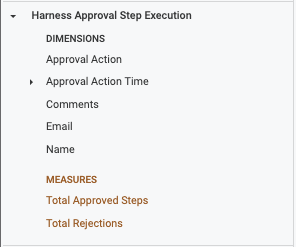
List of dimensions:
- Approval Action: Action taken for the approval(
APPROVE/REJECT) - Approval Action Time: Time at which approval action was done
- Comments: Comments added to the approval action
- Email: Email of the user who took the action
- Name: Name of the user who took the action
List of measures:
- Total Approved Steps: Total no. of approved harness approval steps
- Total Rejections: Total no. of rejected harness approval steps
Jira Step Execution
This view contains the data related to the Jira Step Executions. If any field from this view is selected it will only show the data related to the executions which have a Jira steps(JIRA CREATE/UPDATE/APPROVAL). For e.g. if their are some Jira steps and Harness Approval steps in a single pipeline execution, then selecting fields from this view, will only show Jira steps data.
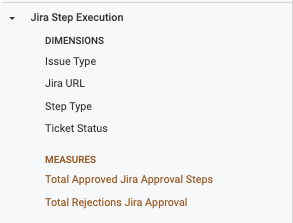
List of dimensions:
- Issue Type: Jira ticket issue type
- Jira URL: URL of the jira ticket
- Step Type: Step type of the jira step(
JIRA CREATE/JIRA UPDATE/JIRA APPROVAL) - Ticket Status: Status of the jira ticket
List of measures:
- Total Approved Jira Approval Steps: Total no. of approved jira approval steps
- Total Rejections Jira Approval: Total no. of rejected jira approval steps
Organization Tags
This view contains the data related to the organization tags. It will contain the real-time tags of the organization.
List of dimensions:
- Organization tag: The organization tag, it will be displayed as
key:value. If there are let's say 5 tags in an organization, there will be 5 rows having 1 tag(key:valuepair) in each row
Organizations
This view contains the data related to organizations.
This will only show the organizations, which had atleast 1 pipeline execution(in any project). It won't display the organizations which didn't contain any pipeline execution.
List of dimensions:
- Organization tag: The organization tag, it will be displayed as
key:value. If there are let's say 5 tags in an organization, there will be 5 rows having 1 tag(key:valuepair) in each row
Pipeline Tags
This view contains the data related to the pipeline tags. It will contain the real-time tags of the pipeline.
This will only show the pipelines, which had atleast 1 pipeline execution. It won't display the tags for the pipelines which didn't get executed even once.
List of dimensions:
- Pipeline tag: The pipeline tag, it will be displayed as
key:value. If there are let's say 5 tags in a pipeline, there will be 5 rows having 1 tag(key:valuepair) in each row
Service Tags
Displays a list of tags associated with a service.
Service Tags only displays the tags for the services that were part of pipelines that were successfully executed at least once.

List of dimensions:
- Service tag: The service tag is displayed as
key:value. For example, if there are 5 tags in a service, there will be 5 rows having 1 tag (key:valuepair) in each row.
Environment Tags
Displays a list of tags associated with a environment.
Environment Tags only displays the tags for the environments that were part of pipelines that were successfully executed at least once.

List of dimensions:
- Environment tag: The environment tag is displayed as
key:value. For example, if there are 5 tags in a environment, there will be 5 rows having 1 tag (key:valuepair) in each row.
Pipelines
This view contains the data related to the pipelines.
This will only show the pipelines, which had atleast 1 execution. It won't display the pipelines which didn't had any execution.
List of dimensions:
- Created Time: Creation time of the pipeline
- Modified Name: Modification time of the pipeline
- Pipeline Name: Name of the pipeline
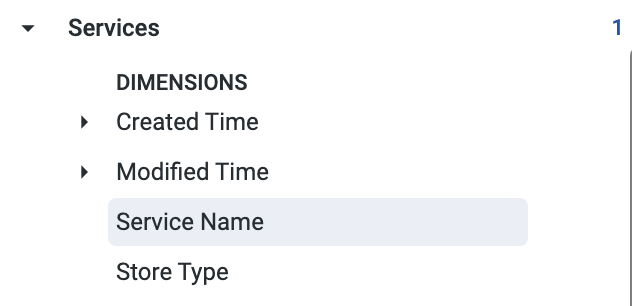
Services
This view contains the data related to the service.
List of dimensions:
- Created Time: Creation time of the service
- Modified Name: Modification time of the service
- Service Name: Name of the Service
- Store Type: Indicates whether Service as INLINE OR REMOTE.
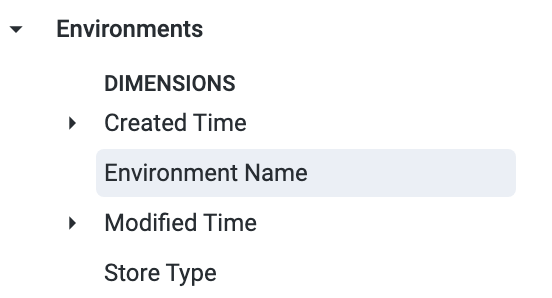
Envrionments
This view contains the data related to the environment.
List of dimensions:
- Created Time: Creation time of the environment
- Modified Name: Modification time of the environment
- Environment Name: Name of the environment
- Store Type: Indicates whether environment as INLINE OR REMOTE.
Projects
This view contains the data related to the projects.
This will only show the projects, which had atleast 1 pipeline execution. It won't display the projects which didn't had any pipeline execution.
List of dimensions:
- Created Time: Creation time of the project
- Modified Name: Modification time of the project
- Project Name: Name of the project
Reverted Deployments
This view contains the data related to the pipeline executions which have been reverted.

Filter-only Field:
- Current Aggregation Period:
List of dimensions:
- Deployment Duration: Duration of the pipeline execution
- End Time: End time of the pipeline execution
- Is Revert Execution (Yes / No): Specifies if the execution got reverted
- Organization ID: Organization identifier where the pipeline got executed
- Original Execution ID: Original execution id of the pipeline which got reverted
- Pipeline Name: Name of the pipeline
- Project ID: Project identifier where the pipeline got executed
- Start Time: Start time of the pipeline execution
- Status: Pipeline status(
RUNNING/ABORTED/SUCCESSetc.) - Trigger Type: Type of trigger used to execute the pipeline(
MANUAL/WEBHOOKetc.)
List of measures:
- Failed Deployments: No. of deployments that failed with
FAILED/ABORTEDstatuses - Failure Rate: Failure rate of deployments(Failed Deployments divided by total no. of deployments)
- Last Deployment: Last deployment time
- Longest Deployment: Longest deployment time
- Mean duration: Average pipeline duration
- Mean duration trend: This compares the mean duration trend from the previous period to the current period
- Mean Time to Restore: Measures the mean time to restore
- Median Duration: Median duration of the deployment
- Success Rate: Success rate of deployments(deployments completed with
SUCCESSstatus) - Total Deployments: Total no. of deployments
- Total Deployments Trend: This compares the deployment count from the previous period to the current period
Runtime Inputs
This view contains the data related to the runtime inputs provided at the time of the pipeline execution. This will contain only the user provided runtime inputs when a pipeline is executed.
- This doesn't show nested runtime inputs. For e.g. let's say a service has a variable as runtime input, and a pipeline has service also as runtime. Then we won't show the service variable in the list
- This doesn't store execution inputs.
List of dimensions:
- FQN: FQN of the runtime input
- Input Key: Key of the runtime input
- Input Value: Value given to the runtime input
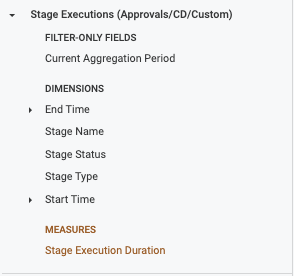
Stage Executions (Approvals/CD/Custom)
This view contains the data related to the stage executions. Currently, it only shows data for Approvals/CD and Custom stages.
Filter-only Field:
- Current Aggregation Period:
List of dimensions:
- End Time: End time of the stage execution
- Stage Name: Name of the stage
- Stage Status: Current status of the stage(
RUNNING/FAILEDetc.) - Stage Type: Type of the stage(
Approvals/CD/Custom) - Start Time: Start time of the stage execution
List of measures:
- Stage Execution Duration: Average stage execution duration
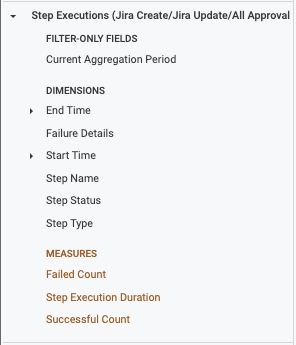
Step Executions (Jira Create/Jira Update/All Approval Steps)
This view contains the data related to the step executions. Currently, it only shows data for these steps:
- Jira Create
- Jira Update
- Jira Approval
- Custom Approval
- ServiceNow Approval
- Harness Approval
Filter-only Field:
- Current Aggregation Period:
List of dimensions:
- End Time: End time of the step execution
- Failure Details: Failure message of the step(if it failed)
- Start Time: Start time of the step execution
- Step Name: Name of the step
- Step Status: Current status of the step(
RUNNING/FAILEDetc.) - Step Type: Type of the step
List of measures:
- Failed Count: No. of step executions that failed with
FAILED/ABORTED/EXPIREDstatuses. - Step Execution Duration: Average step execution duration
- Successful Count: No. of step executions that completed with
SUCCESS/SUCCEEDEDstatuses.
Users
This view contains the data related to the users.
This will only show the users, which have triggered atleast 1 pipeline execution. It won't display the users which didn't trigger any pipeline execution.
List of dimensions:
- Created At: Time at which user was created
- Email id: Email id of the user
- Updated At: Time at which user was updated
- User Name: User name